Johns Hopkins Carey Business School
BU.152.740.81.FA17 CityLab Toolkit:
Business for Urban Social Innovation and Impact
Krystofer Dongjae Kim
W1 Brief:
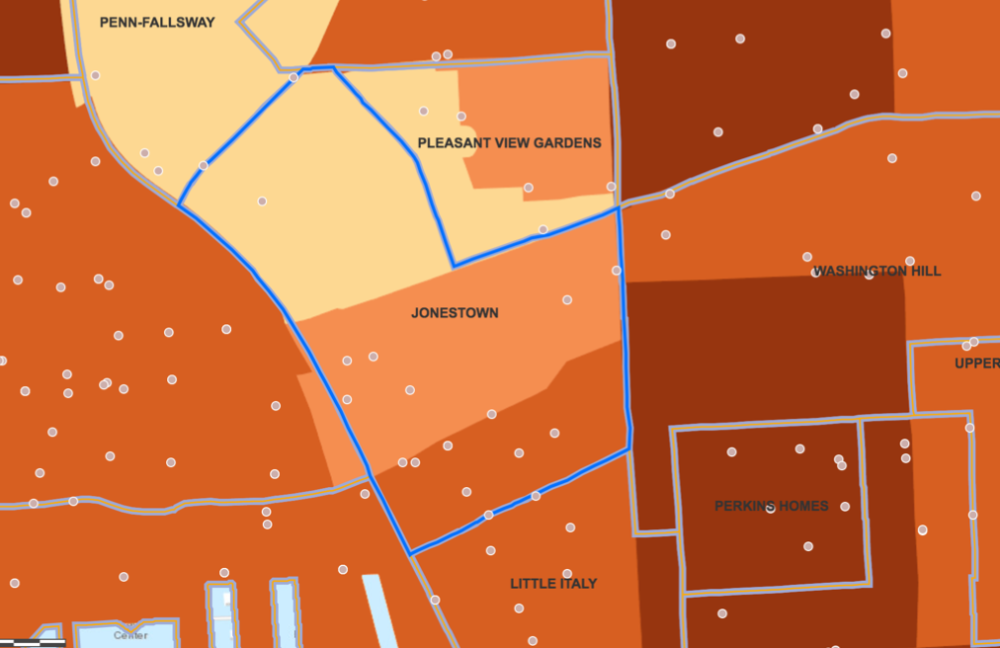
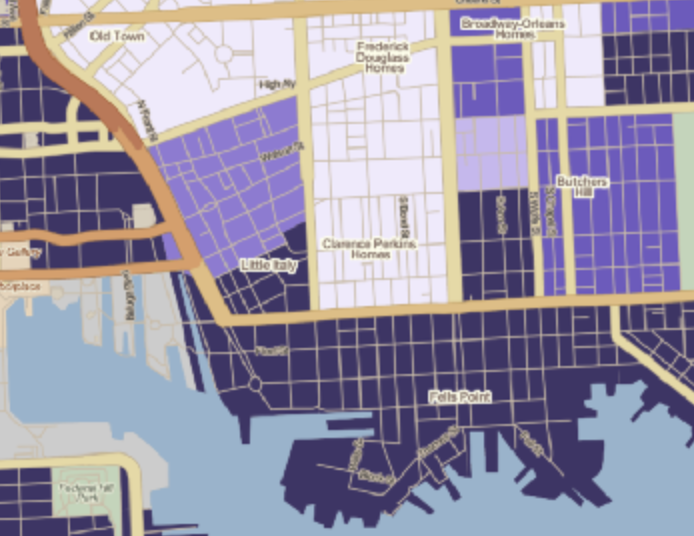
I chose to start at this location, synagogue parking lot, because it is pretty unique. It is in the transitional area from the inner Harbor to North Baltimore. Because the area is surrounded by residential neighborhoods and religious organizations, foot traffic of outsiders are rare.
The rare-closed-in, 14-car, synagogue parking lot, is open to public all the time. But the synagogue is in session only in the weekend. However, the parking fills up during the weekdays from early morning and most cars are gone by 6:30 p.m. (with the exception of a black nondescript police vehicle with punctured tire and a cab.)
Residents get their parking spot for included. This means these are working professionals that utilize this parking space during the week. Not the residents.
This leads to the big theme of the ability to commute to work which is central to being livable. There may be interesting insights to people who utilize parking lot. Where they commute from, what their professions are or if they are Carey students and why they don’t live in Jonestown. And perhaps if they have any affiliation with Jewish community or the synagogue.
W2 Brief:
W3 Brief:
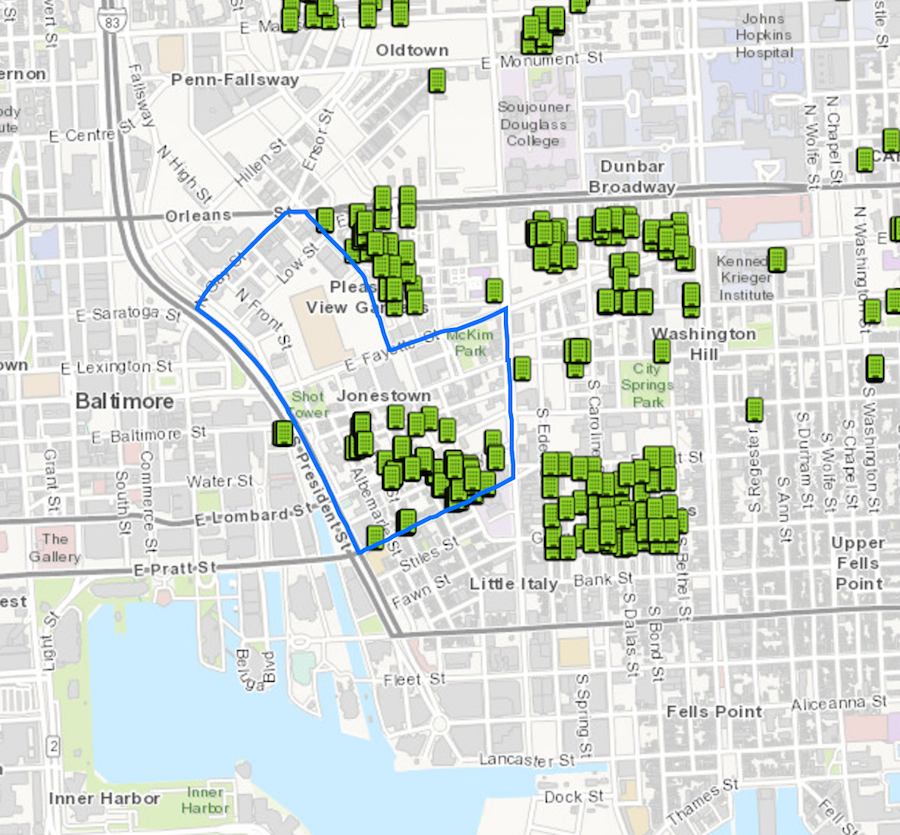
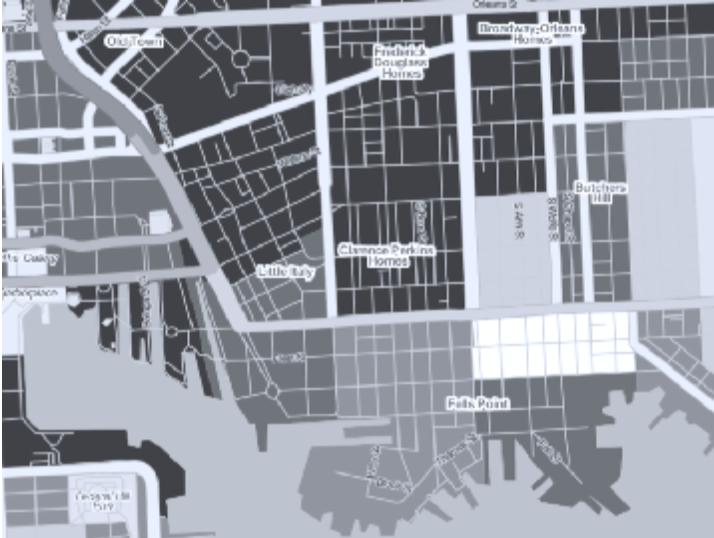
This map plots the number of vacant lots and properties in Jonestown. These abandoned properties gives birth to perception of ‘ghost town’ and ‘unsafe’ environment as they can be a target or breeding ground for criminal activities.
W4 Brief:
W5 Brief:
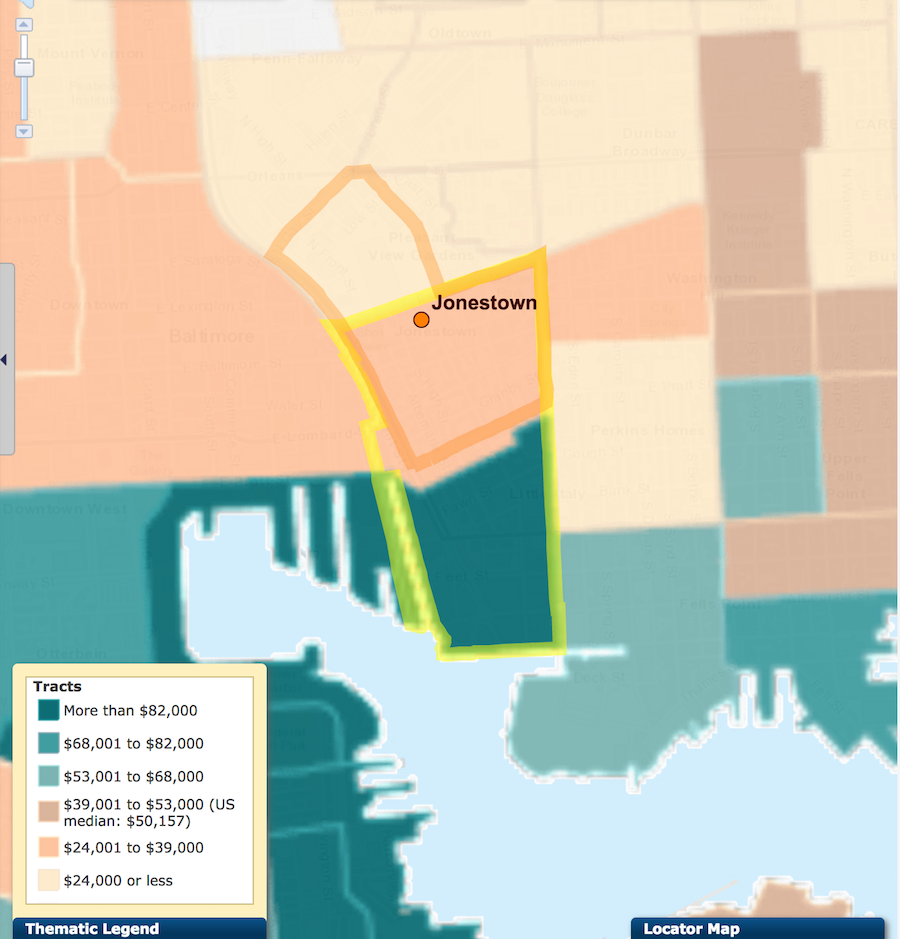
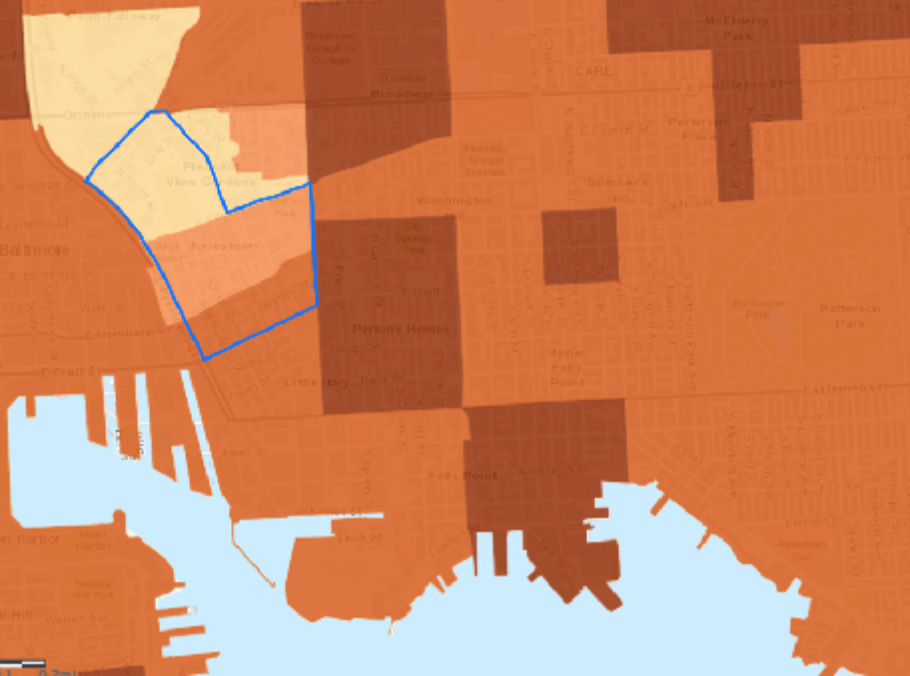
Fayette street a dividing line between south and north of Jonestown; usually indicated that the north side of Fayette Street is poorer, with more crime and less income.
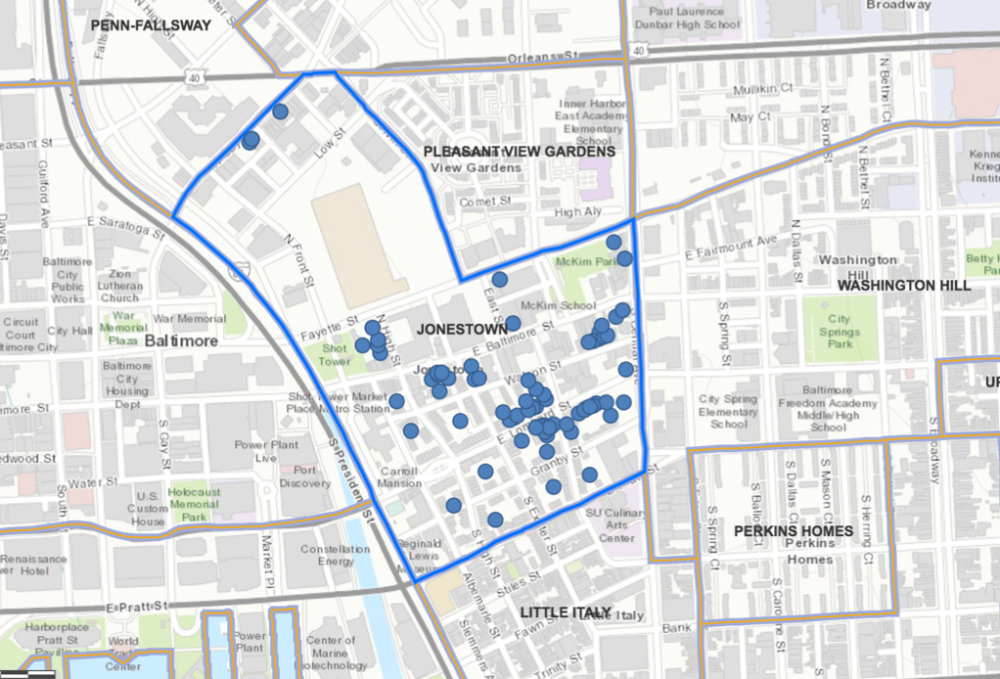
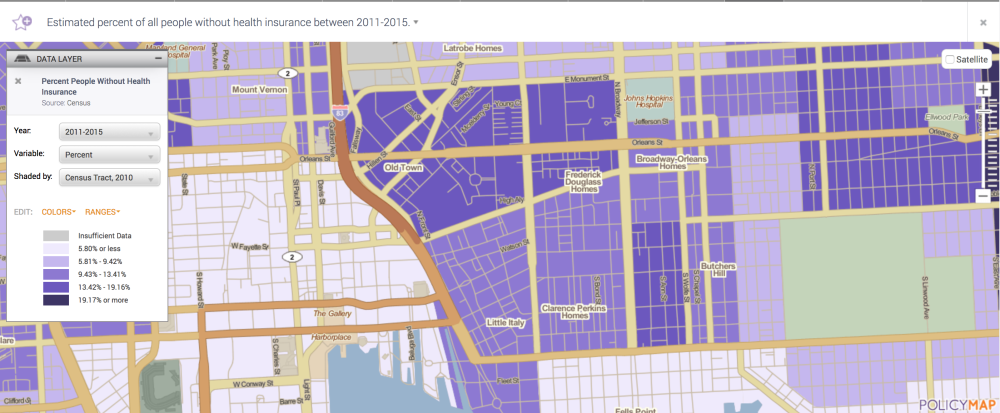
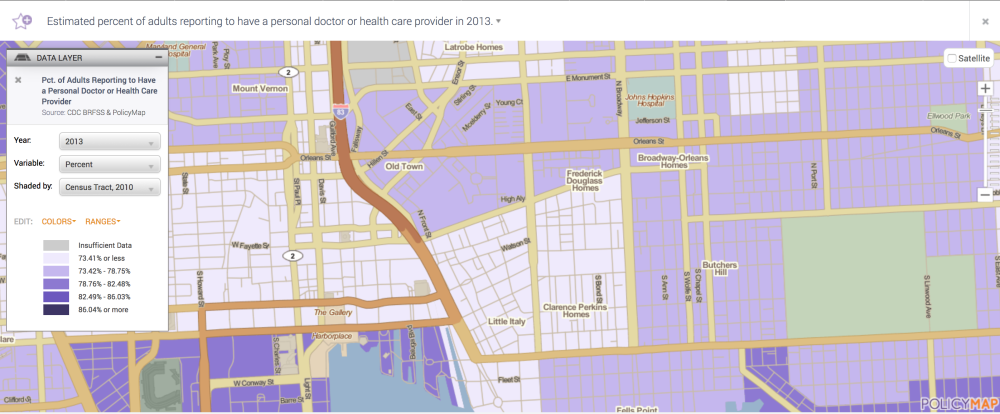
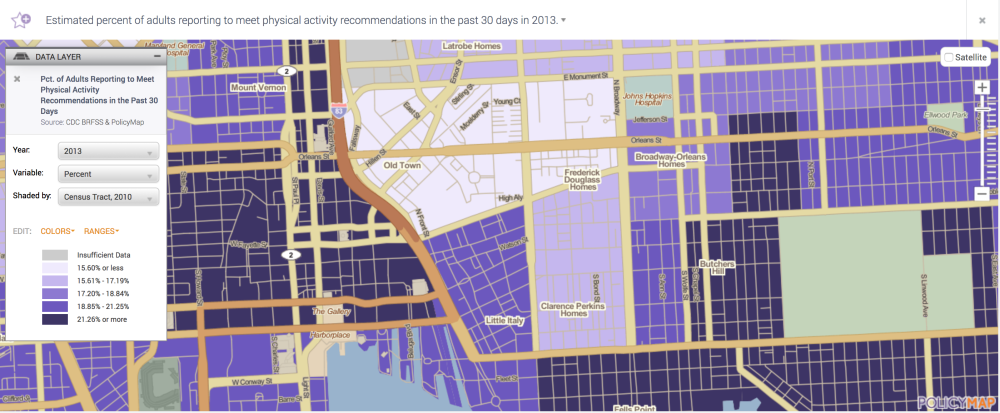
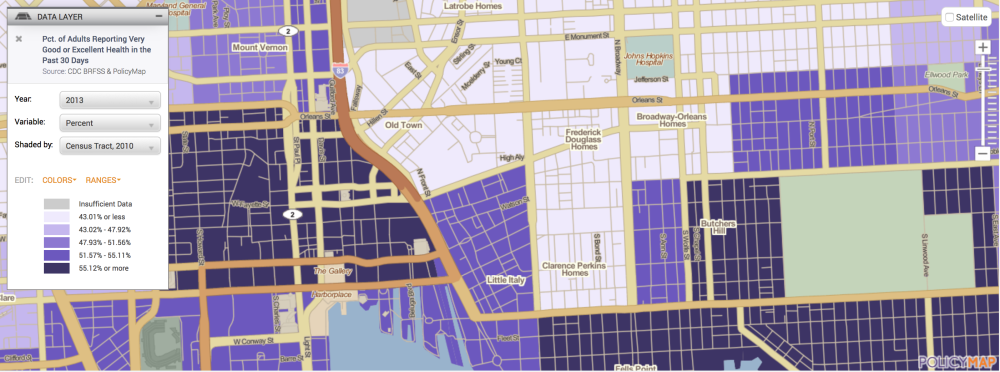
After deciding the theme of this week as “health” after coming across Johns Hopkins Hospital and Week 4 resources, I looked into some health data. First it was not unusual to see that positive perception of self-assessed health was very low except for little Italy. Also physical activity was much higher in Little Italy (and the Perkins home this is due to younger generations and the kids who clean car windows factored in as physical activity) where as North side of Fayette, showed very low physical activity.
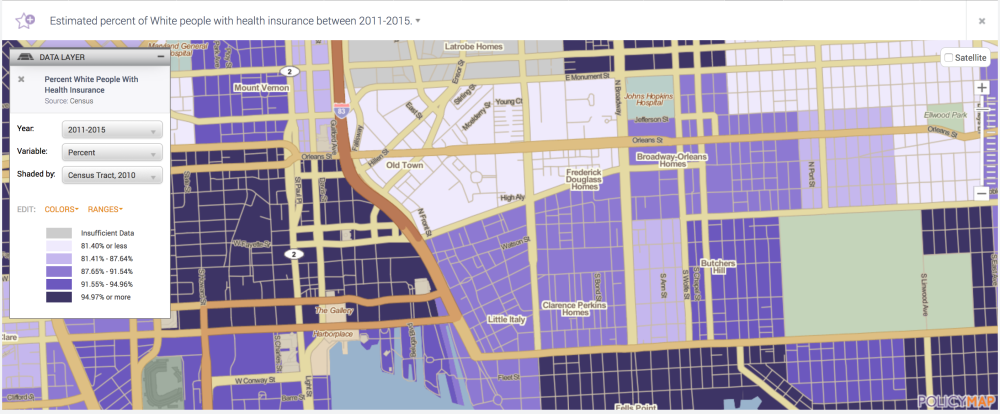
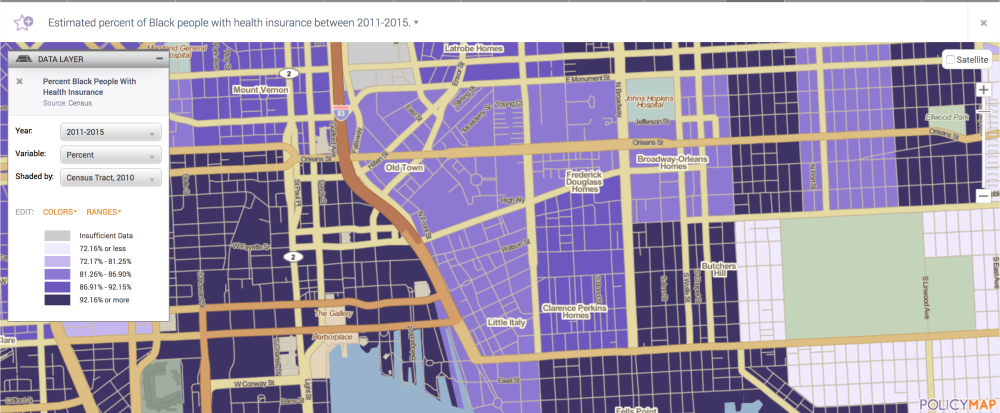
Strangely, the story is different when it comes to health care itself. Overall, healthcare coverage did not have a drastic difference in all of Jonestown, if anything, I was surprised to find that white people had less health insurance coverage especially on the North side.
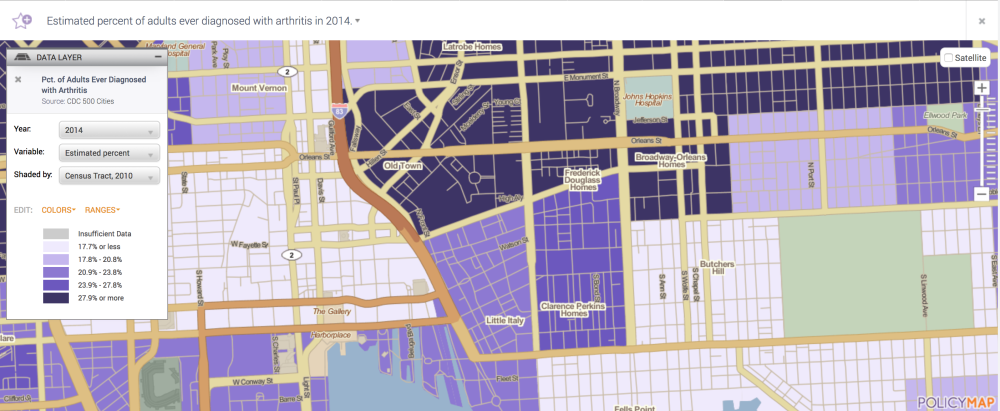
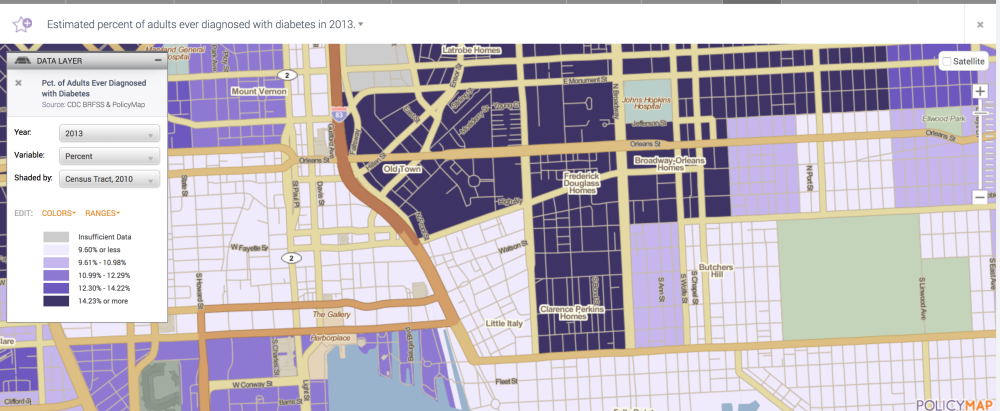
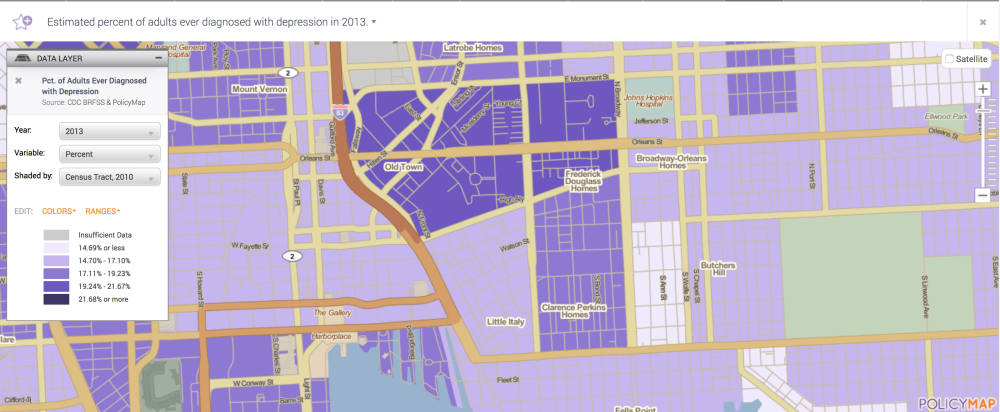
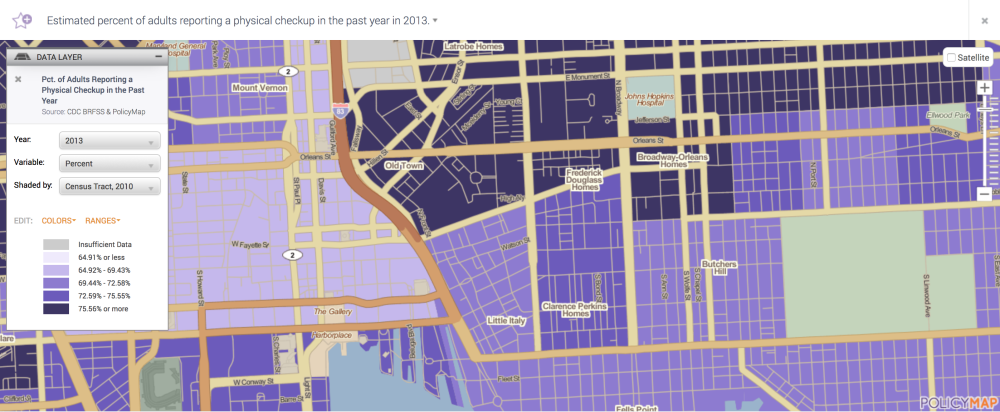
But the most interesting thing was how North Side people who has less physical activity, and poorer perception of Health, also had more likely to have a primary care doctor, insurance, and routine check up. When I followed it up with Data on chronic diseases, those north areas corresponded with higher diagnosis of arthritis, depression, and diabetes.
My last realization was that perhaps I should not have been surprised that lower income neighborhood would be more prone to overwork, at risk for injury due to lack of knowledge, education, violence that can all lead to more need for healthcare.
Big question, that has yet to be answers, arose amid discussion with colleagues about what can Johns Hopkins Hospital do? in junction if Carey Business school? combining knowledge on business, urban planning and health care? How can those two specialties serve this neighboring community to be healthier, be preventative in long-term, improve quality of life?
W6 Brief:
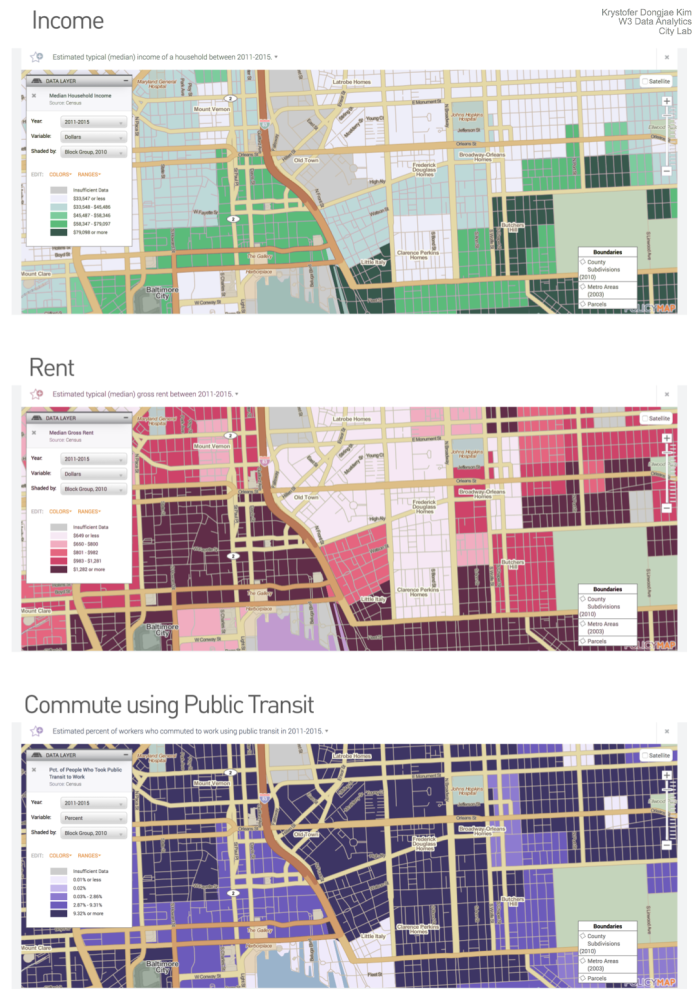
Mapping the Rent. Compared to Lombard Street, Jonestown, it costs nearly twice as much to live in Fells Point.
Mapping number of Non-whites. Entering the southern region, Fells point, sees a sudden drop-off in Non-White residents.
Mapping number of violent crimes (Aggravated Assaults) Fells point has more AA crimes than the Jonestown. (Lombard street.)
W7 Brief:
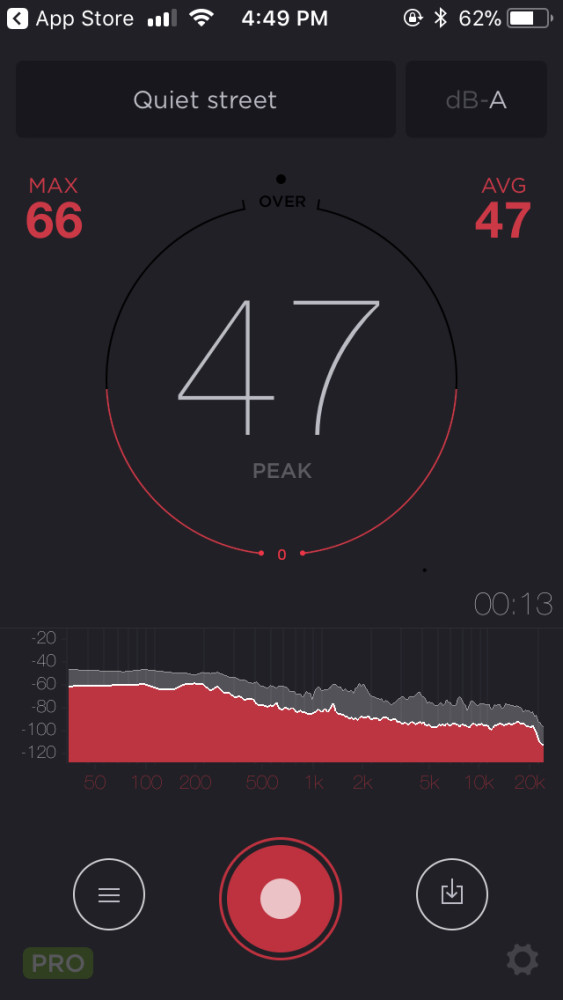
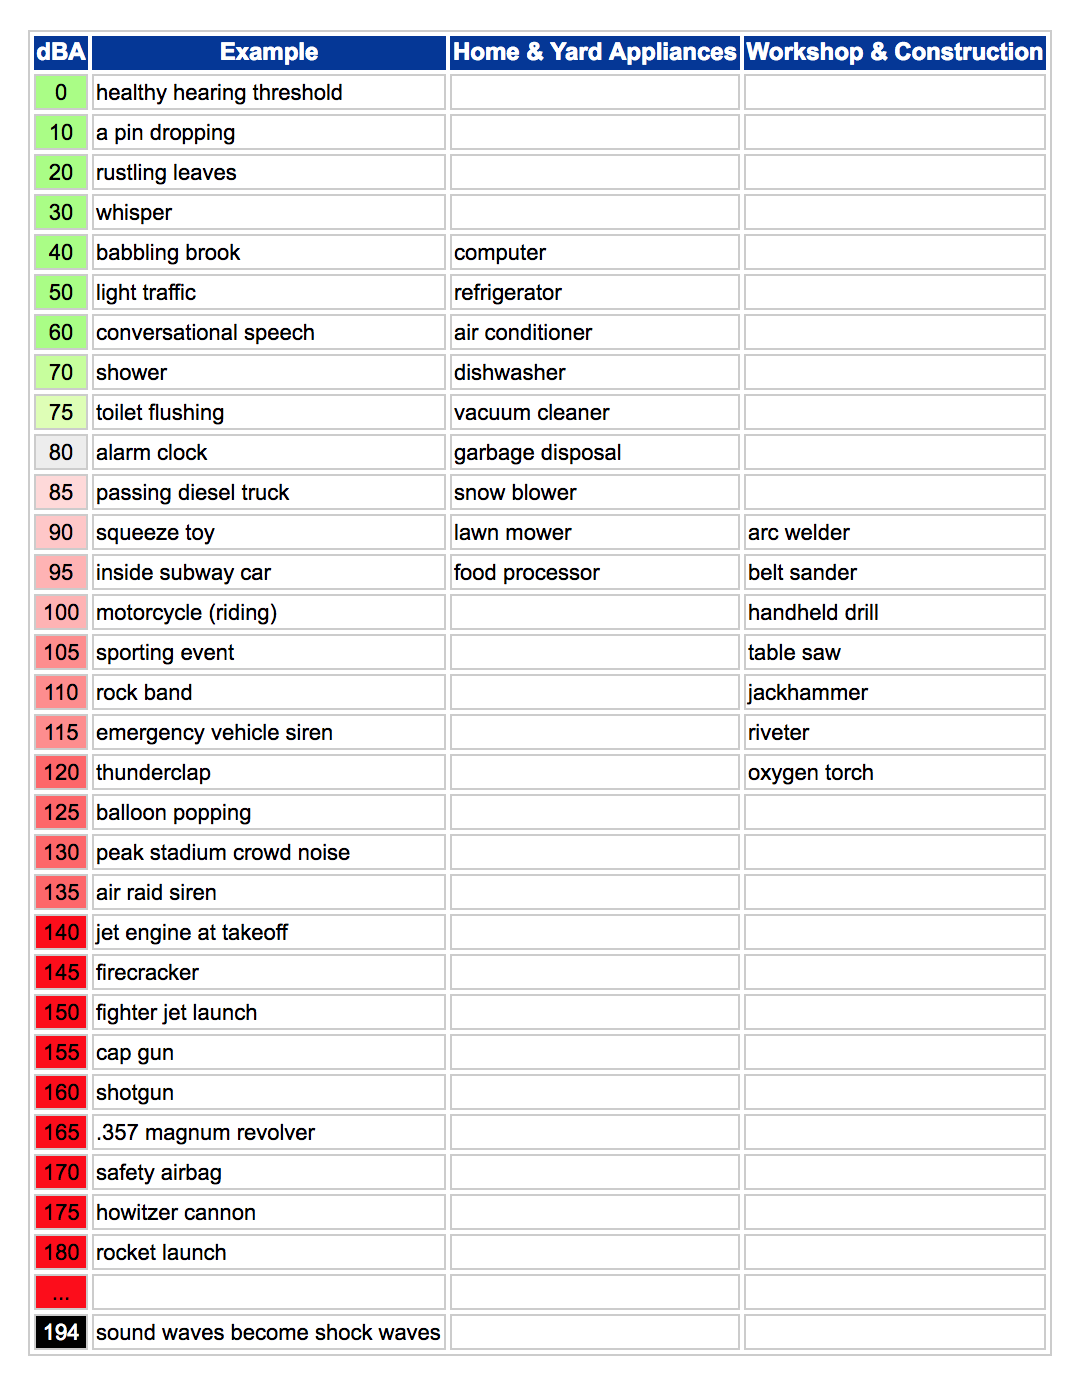
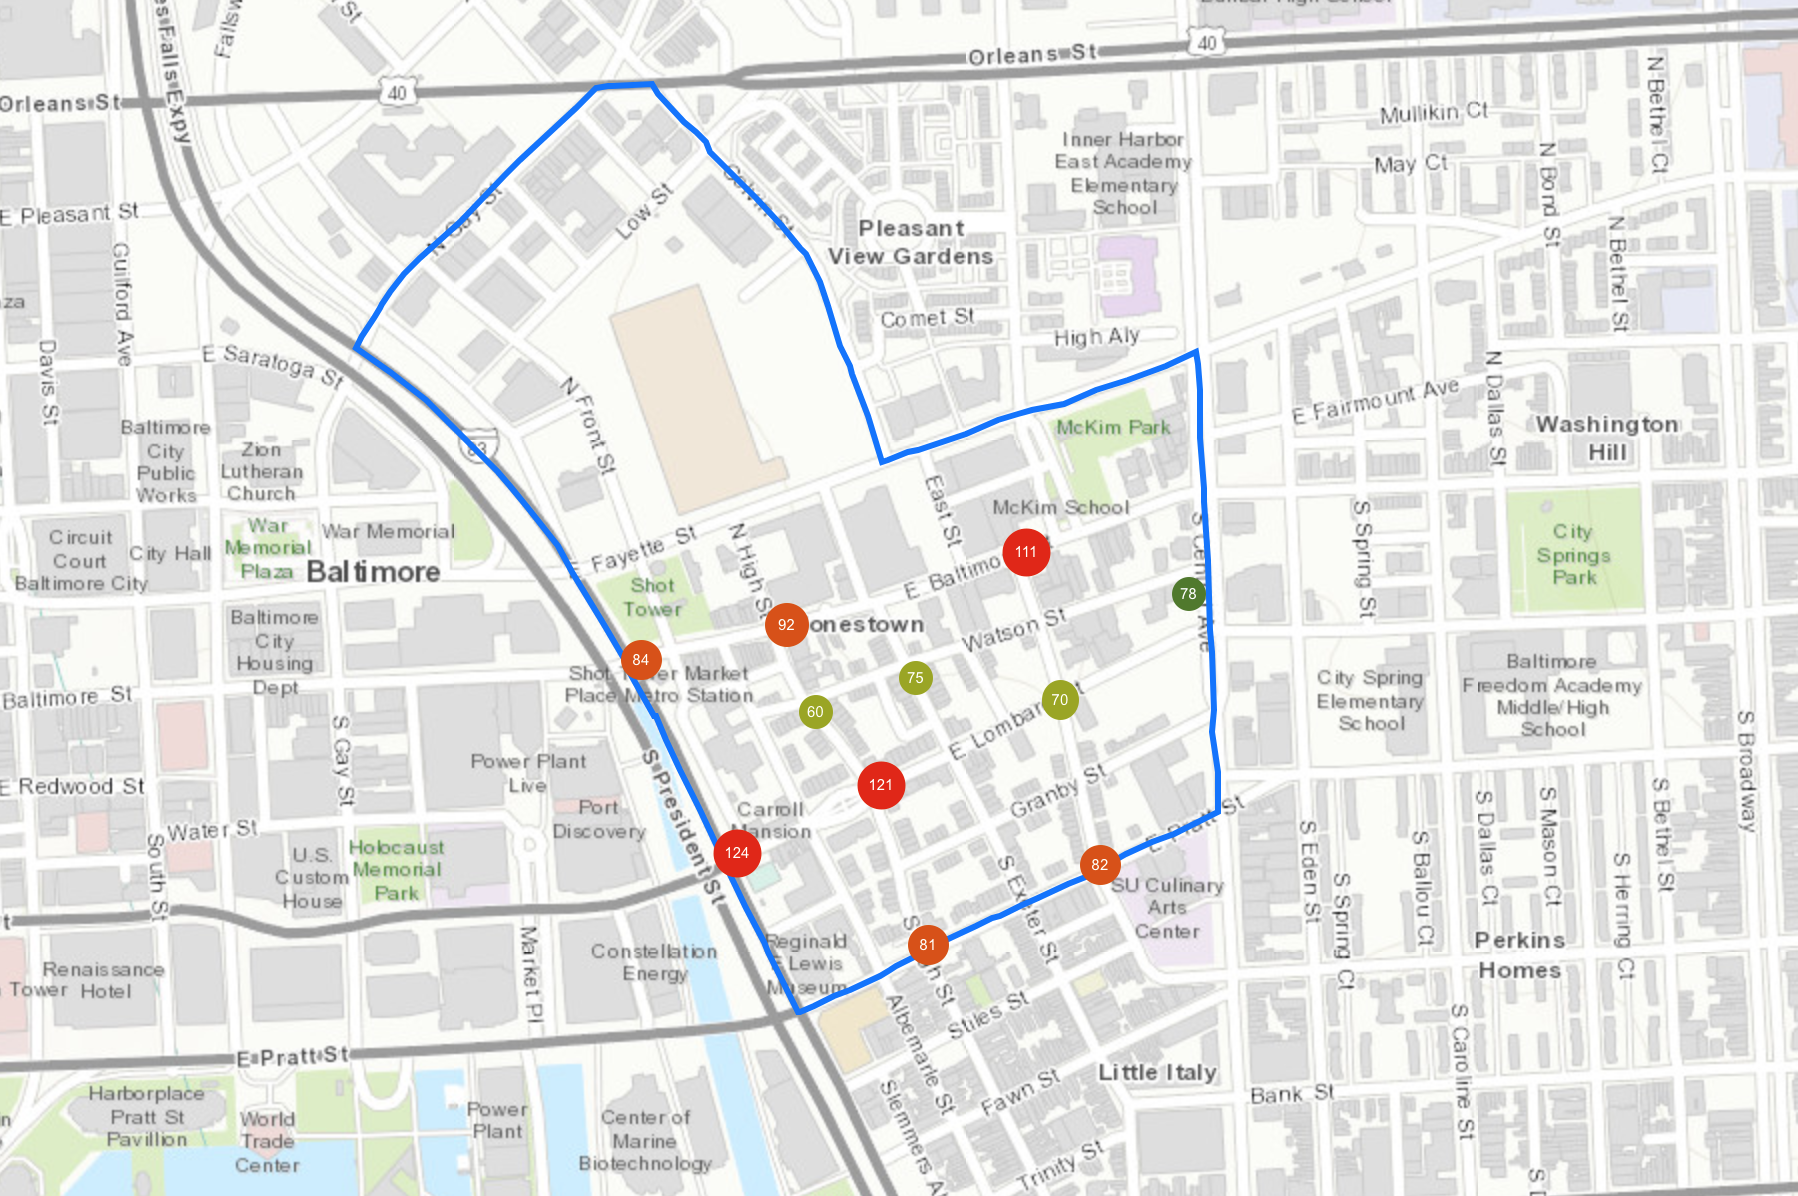
Today’s field note was inspired by a chat with a resident I conversed with near Lenny’s Deli. Her name was Dee and when the topic of livability came up, one of the first thing she spoke of was noise. According to Dee, she would “move to somewhere she can hear the calm waters.” Inspired by this, I decided to measure the noise level inside the Jonestown boundary with a noise meter app on my phone. Recordings were generated but the files weren’t able to be salvaged. But it was 80%-90% were traffic noises.
Below are the metrics used to measure. To have a comparison point, in quiet Carey room alone, it was at 47 dB.
When discussing the issue of noise pollution, first perspective common was that any pollution would correlate with the poverty level. According to the study done by UC Berkeley researchers:
“The researchers found a strong correlation between noise and race. The researchers looked at how noise levels correlated with the demographics of neighborhoods across the country, focusing on five racial and ethnic groups: Asians, blacks, Hispanics, Native Americans and non-Hispanic whites.”
Looking back through previous themes I explored in this class, the neighborhood’s unmistakeable connection to automobile and businesses surrounding automotive would be a connecting piece to these data though I am still not able to discern what it really means.
In relation to people, the high noise level would mean that it discourages people from simply being active in the streets, converse and bond due to constant conversation disruption. Due to the big roads dissecting the neighborhood, also implies that, it’s a drive-through community and not a destination. This is also detriment to anyone with children living in the area.
In hindsight, I should have taken more samples to compare with neighboring area to compare previous data with the collected noise data. There was also a sign related to deaf children which I would like to explore further.